Name:LIU Feng
Tell:
Email:liufeng@wbgcas.cn
Organization: Wuhan Botanical Garden
How Environmental and Vegetation Factors Affect Spatial Patterns of Soil C and N ?
2016-08-30
Ecosystems are often characterized by complex environmental heterogeneity. Local soil organic carbon (SOC) and total nitrogen (TN) patterns can be influenced by many biotic and abiotic factors. However, little is known about the relative contributions of environmental factors and vegetation to spatial variations in soil C and N, especially in highly diverse mixed forests.
LI Qianxi, under the supervision of Prof. LIU Feng from Wuhan Botanical Garden, conducted a study in a 25-ha plot in Badagongshan in central China to investigate the spatial variations of SOC and TN, and their controlling factors.
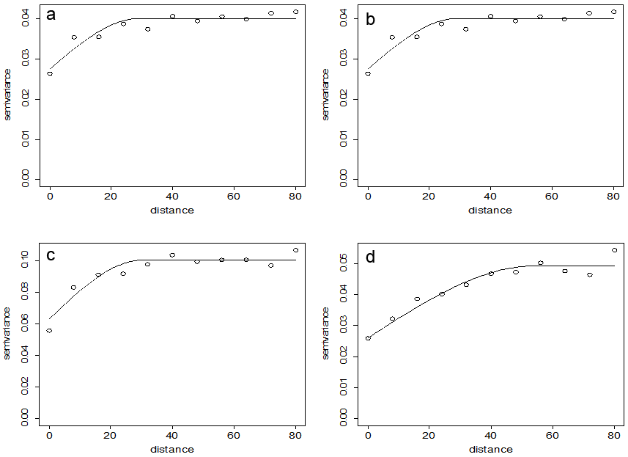
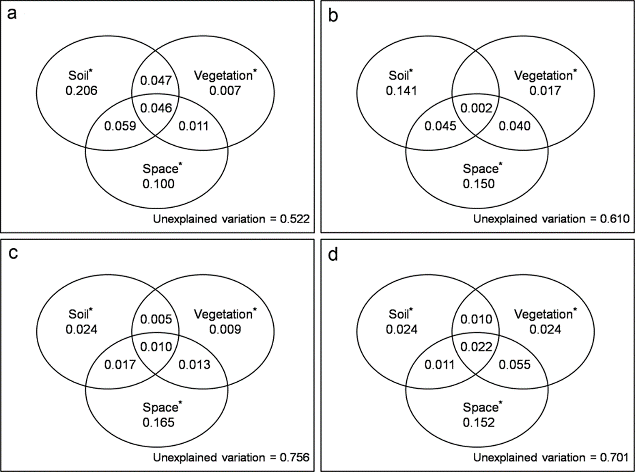
Study revealed that subsurface soil (10–30 cm) had a slightly strong special autocorrelation in SOC and N than the surface soil (0-10 cm). The highest contribution to SOC and TN variation came from soil variables (including soil pH, available phosphorus and soil texture), followed by vegetation and topographic variables, with strong interactions among these variables. The explanatory power of surface soil was much higher than the subsurface soil.
These results suggest that there are differences in the dominating ecological processes in the two soil depths. The large unexplained variation emphasized the importance of fine-scale variations and ecological processes. Large variations in soil C and N and the differences in their determining mechanisms should be taken into account when evaluating how forest managements may affect C and N cycles regionally and globally.
Results were published in Journal of Soils and Sediments entitled “How environmental and vegetation factors affect spatial patternsof soil carbon and nitrogen in a subtropical mixed forest in Central China”. This study was funded by the National Basic Research Program of China and the National Natural Science Foundation.

Semivriograms of Box-Cox transformed SOC (a) and TN(b) concentration in 0–10cm depth range and SOC (c) and TN (d) concentration in 10–30 cm (Image by LI Qianxi)

Variation partitioning results of SOC (a) and TN (b) in0–10-cm depth range and SOC (c)and TN (d) in 10–30-cm depth range against the soil (without soil texture data), vegetation, and spatial variables (Image by LI Qianxi)